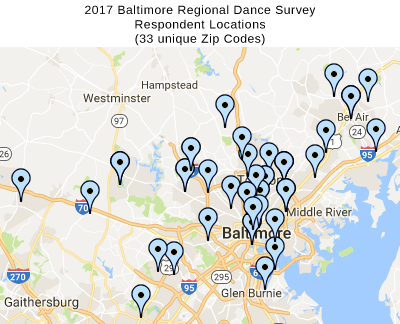
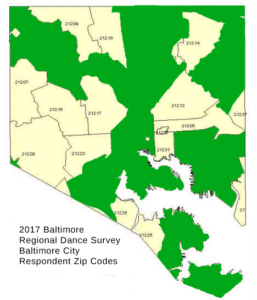
As the name suggests, I hope to understand the regional dance economy, so one of the first questions – Did the survey reach “the region”? We are still dealing with a relatively small sample size (a total of 53 respondents completed the entire survey and provided valid Zip Codes, 33 of them unique), but the results there are encouraging…

There may be a bit of a coverage gap along the I-95/295 corridor on the south side of the city and around Ellicott City (I’ll have to compare that to studio data before I make any sort of conclusions), but broadly speaking, it looks like a reasonably solid representation of the Baltimore region.
Within the city, there is a north-south corridor within the city (Zip Codes 21201, 21202, 21218, 21211, 21212, 21239) that is represented, and the east-side/west-side are scattered at best. There is a lot of history that plays into maps that look like this….

If anyone has suggestions about reaching into the gaps demonstrated above and finding the dancers that live there, I would very much like to hear from you.
One thought on “Baltimore Regional Dance Survey – The Geography of Respondents”