After a bit of a break to actually make some dance performance stuff happen, it’s time to get back to the BRDS data. Having spent some time exploring learning and teaching, I finally get to dive into the performance dimension of dance in Baltimore.
We start with some simple questions… How often did you perform in 2016 and where?
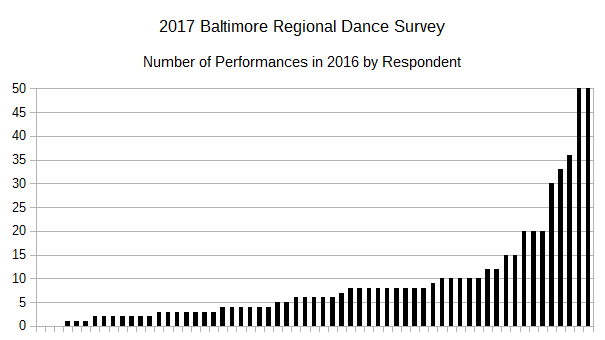
61 Respondents submitted a number of performances for 2016 (some of them 0), adding up to a total of 553, or just about 9 (9.07) per respondent. That makes once every 40 days or so. Of course, this is not evenly distributed among the dancers of the region –

With this pool of respondents, we have two that are performing basically every week and three that did not perform at all in 2016.
And where did these performances happen? This was literally a fill-in-the-blank response, so there’s some variations in approach from each respondent. Some submitted specific venues, some submitted generic venue-types, some just submitted city, state, or even country locations without any further detail. Having said all that, I managed to extract what I think are 191 meaningful responses to the question.
Here are the most popular (3 mentions or more):
Baltimore Theatre Project (10 mentions)
Towson University (covers several spaces) (10 mentions)
Creative Alliance (6 mentions)
Gordon Center (6 mentions)
Atlas (Washington DC) (4 mentions)
Goucher College (covers several spaces) (4 mentions)
Baltimore Museum of Art (4 mentions)
Slayton House (4 mentions)
Howard Community College (3 mentions)
Windup Space (3 mentions)
So there are a few missing from the site directory on the front page – I’ll try to fix that in reasonable time (Atlas is out-of-range, Windup space doesn’t do rentals, but I should cover the suburbs better). Also interesting, there are some rockstar dancers here in Baltimore – we have performers at the White House, Kennedy Center, and even the Flamingo Hotel in Las Vegas. We also have some apparently forgettable performance venues “Some restaurant in Columbia” and “Senior Center.”